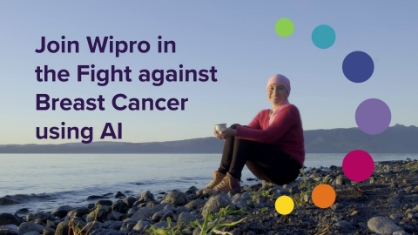
We're fueling the next wave of AI-driven innovation by infusing AI across our ecosystem—into every tool, platform, and solution, across every business function, process, and practice.
Wipro ai360 brings together all our AI capabilities, talent, and technology to help clients connect AI throughout their organizations. Because at Wipro we believe that combining human ingenuity with AI-powered technology is the key to unlocking the true value of AI.

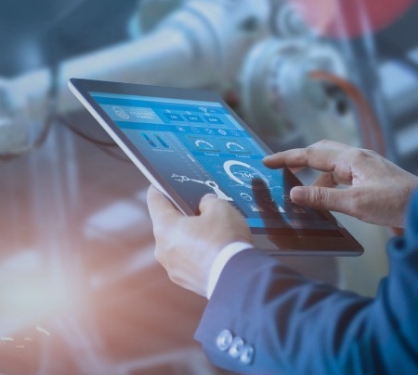
Wipro is a recognized leader in AI
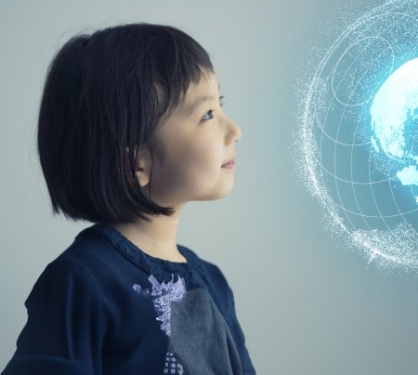
Connecting patients and healthcare providers
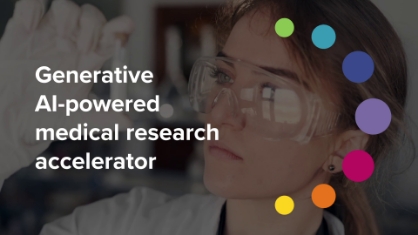
AI-powered medical research accelerator
Analyst Reports
Wipro Leads with AI in Digital Era: Recognized as Horizon 3 Market Leader in HFS Horizons Generative Enterprise™ Services, 2023
Wipro recognized as a ‘Leader’ in Avasant’s Applied AI Services 2023 RadarView™
Wipro positioned as a leader in the IDC MarketScape: Worldwide AI Services 2023 Assessment
Wipro positioned as a leader in the IDC MarketScape: Worldwide AI Services 2023 Assessment

Wipro Recognized on Constellation ShortList™ for Global AI Services for 2023
Contact Us


 Locations