Process and asset safety are important business processes in industries such as mining, Oil & Gas, and other natural resources. Traditionally Health, Safety and Environment (HSE) operations within these industries rely upon review of processes, tool talks, training, and other process-led mechanisms to manage safety. There is an array of technologies ranging from sensors, SCADA systems, Plant Monitoring Systems, but it is only in the last couple of years that companies have started to invest in systems that can generate insight on safety performance and process safety readiness.
Introduction
The Texas refinery incident in the US in March 2005 was a wakeup call to the Oil and Gas industry because it questioned the sense of managing status quo.
The Baker panel report states that “The passing of time without a process incident is not necessarily an indication that all is well and may contribute to a dangerous and growing sense of complacency.”
Since current systems in place largely track historical KPI indicators via lagging indicators such as LTIFR, DART (Days Away/Restricted or Transfer Rate), production loss, work stoppage etc. , the Baker panel report and associated studies by OSHA and other regulatory bodies have recommended a new mode of managing safety based on a term “Proactive or Predictive Risk Management”.
For this, companies have to list the contributing factors that lead to injuries, fatalities, work stoppage, spills and releases and create a new set of KPIs called leading indicators. Instead of doing root cause analysis on “What went wrong”, studies now recommend that companies measure contributing factors that lead to lesser safety or more accidents.
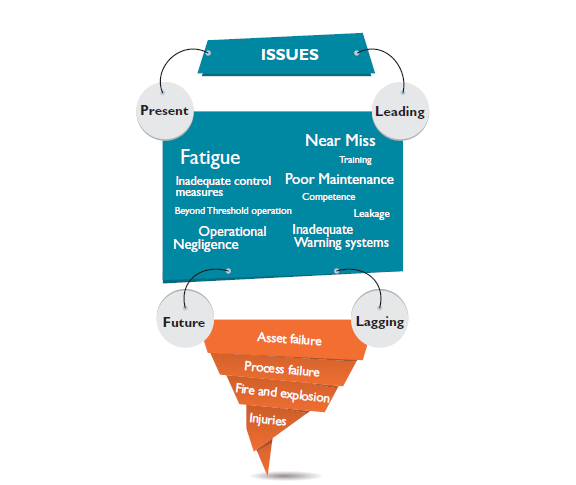
1.0 What is a Next Generation HSE Risk Management System?
In the context of ‘Baker panel report’, and incidents such as Texas refinery and Gulf of Mexico, a next generation HSE risk management system could consist of a process and system that can manage insights into competence, operational, process safety, environmental safety, occupational safety risks on a continuous basis, so as to reduce risk as part of ongoing operations. With growing use of advanced analytics, a HSE risk management solution should also be capable of incorporating statistical and analytical abilities into the information that it processes.
2.0 Starting the Journey to a Next-Generation Risk Management System
To begin the journey into a next-generation risk management process, enterprises have to understand their maturity in IT, Process, Technology and Data to move forward on implementing a next-generation risk management system.
2.1 Maturity Assessment of Current HSE Processes
As a next step, enterprises should develop a roadmap for achieving maturity in HSE risk management. Assessment of maturity can begin with a questionnaire such as the one given here.
2.1.1 Identifying the As-Is
2.1.2 Defining the To-Be
2.1.3 Identifying the Challenges
2.1.4 Identifying the Opportunities
Depending on answers to the above questions, the journey towards a comprehensive next generation Risk management system begins. The next step involves assessing list of risk variables required for current operations.
2.2 Selection of Leading Risk Variables
Within every process or sub-process in a risk intensive industry, there are multiple levels of safety performance indicators. The study done by the International Oil & Gas producers “Report No. 456, November 2011” [5], recommends a 4–tier KPI approach. The approach in this report outlines a mechanism for a leading risk based risk management method.
Tiered KPI as per Oil & Gas producers Journal, Report 456
These leading risk KPIs can be classified into buckets based on the level of complexity, and accuracy with which KPIs could be measured. Based on available transactional data systems such as ERP or enterprise HSE packaged applications, these KPI buckets could face different degree of complexity of implementation.
The buckets above also represent causative or contributing factors that lead to incidents, accidents. Once the list of risk variables is documented, the next step is to prioritize these risk variables based on three factors – Cost of measuring risk, Speed of risk variable and accuracy of the KPI.
2.3 Prioritizing KPI Selection Based on Cost, Speed and Accuracy
Each KPI set as bucketed above has different difficulty levels and costs associated with collecting them. For some KPIs, data is available, and the cost of measuring them would be cheap. In other cases, data may not be available, but technology to collect these data would be relatively cheaper.
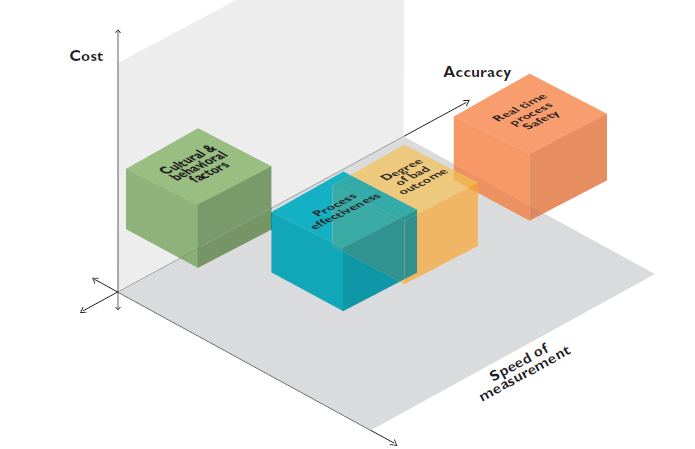
Fig 3: Cost-Accuracy-Speed comparison between risk variable types
The chart above shows a relative cost, accuracy, and speed of measurement of the KPI buckets. KPIs based on real hard data, often provide the most accurate description of risk, but are tough to collect, and cost more to collect and analyze. On the other hand, cultural factors are easy to collect, but often pose difficult challenge of data quality.
In a predictive risk management system, it is important to accelerate speed of measurement, so that insights are available on time before a Black Swan (low probability, high consequence) event arises.
2.4 Defining Relations Between Risk KPIs
While implementing a risk management system, it is important to capture the interdependence between risks, and how they are correlated. For example, poor maintenance of critical equipment can result from reduced asset maintenance costs, and can also result in loss of containment incidents and these could further result in increased injuries at work place. But, we cannot conclude that reducing asset maintenance costs would increase injuries.
So enterprise risk management solution need modules that allow a risk manager to setup measurements that can highlight the relationship and dependence between leading indicators, and risk variables.
2.5 Managing Uncertainty of Risk
Risk management systems also need to design for the delay in propagation of risks. This is required, since the data collection process is based on total lead time between the onset of a risk, and incidence of an event.
For example, if a person operating particular equipment is not trained on the job, then given unfortunate but cohesive conditions, an accident or incident could happen on the job. The propagation delay between the level of training of operator, and accidents here could be in order of weeks or months. In another example, if the temperature of boiler or pressure of superheated steam goes up, then a LOPC (Loss of Primary Containment) incident could occur. The propagation delay between the leading indicator and the lagging indicator in this case could be in minutes or hours, depending on the process and equipment.
The table below shows the degree of uncertainty between the onset of risk and the incidence of a lagging indicator.

Table 1: Propagation delay of leading variables
2.6 Right Scoping the Risk Variables
Implementing a risk management system at a corporate level can help in creating a seamless risk management culture, but measurements taken at a central level can get hidden due to averaging across different organizational units. Risk measurement should be done at reasonable organizational granularity such as process oriented units, or units at each geo level.
Similar processes – The leading indicator is picked from similar process as the lagging indicator. For example, Visibility levels in a mine could be linked to increase in vehicle accidents in the same mine and not to falls and trips due to poor visibility in the warehouse.
Similar geography – A relationship between Level of training to injuries at say APAC and Europe geo level may not yield the right results, as sample data extends across countries where the degree of awareness, regulatory strength, and availability of certified skills etc. may differ from country to country.
Similar organizational control – The effect of a leading indicator may vary depending on the organizational culture or management culture. In fact, the very purpose of leading indicators is to assess the effectiveness of risk management across different organizational units.
The following table shows that a process safety risk indicator needs to be measured and managed at a process or sub-process level. While incident action item completion can be centrally managed by a corporate risk management team, the indicators could be averaged across most business units, without risk of losing the quality of insight.
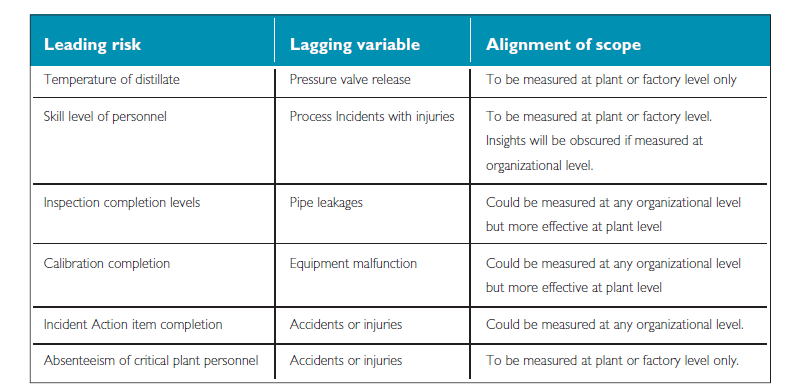
Table 2: Examples of Scope of leading risk variables
3.0 Implementing a Risk Management System – Critical Features Needed
To implement a risk management system, a due diligence method insisting on the following size steps could be adopted.
3.1 Leading and Lagging Indicator Correlation Analysis
Once the 7 steps are setup, a basic system should be in place which can measure the correlation between risk variables. Here are some of the hypotheses on how risks are related.
In reality, however, correlation between these parameters is subject to many other contributing factors.
The methodology of correlation is useful to arrive at a tighter set of KPIs, and a more effective process. This would help the business case justification of setting up an elaborate system for collecting and managing leading indicator KPIs. There are a number of experimental methods to measure correlation of indicators, and one such method is the Pearson’s co-efficient. This method offers a numerical means to determine the following
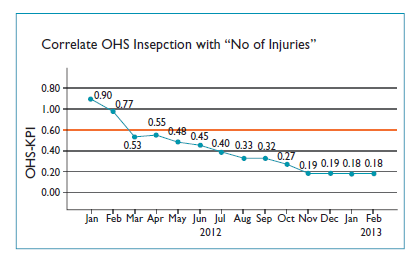
Fig 4: Pearson’s product-moment correlation done for no. of Occupational health & safety Inspections versus Injuries within process
The graph here shows the correlation between number of OHS inspections and number of injuries. Unusual changes in correlation such as one in the data in January, February and March can provide insights.
These methods help unravel data errors, and long term correlation of risk variables. This analysis helps in
Some examples are:
3.2 Identifying ‘Black Swan’ Risks
Black Swan risks are low probability but high consequence events which are described with help of the Swiss cheese model. In this model, each slice of cheese represents a barrier of protection and has a set of holes which represents weaknesses in each layer. As per this model, accidents occur when multiple smaller risks line up in such a way that a risk can propagate through each of the barriers. For example, if the number of corrosion faults increase, and number of preventive maintenance inspections drop, and number of process excursions increase at the same time, a cumulative risk would signal unacceptable levels of risk, which increase chances of a catastrophic accident or event.
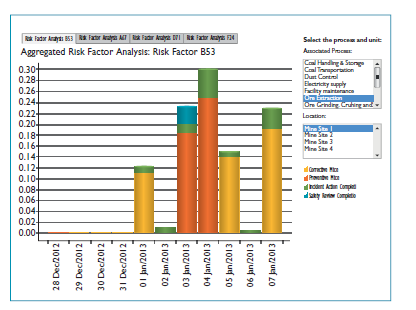
Fig 5: Combinatorial risk involving four different leading variables selected for a process (Ore Extraction) in a particular mine site (Mine site 1)
The above chart shows how cumulative risk increases with increase in individual risk scores of barrier KPI’s. Logically, it means that more than one functional area has become risky due to complacence, or process inefficiency, and combination of inefficiencies could result in a much larger issue such as catastrophic event, or full process shutdown. Management action can focus on defusing the situation based on data collected.
3.3 Bayesian Belief Networks
Further to the above, a truly predictive risk management solution can be built based on its capability to alert management on operations or areas, where Black Swan risk levels are beyond reasonable levels.
The merit of a next generation system would need to come from the ability to precisely calculate probability of risk propagation within connected risks, using available data. For example, within process industries, enough experience is there to get data on how long and whether a pipe corrosion due to salty crude oil input would lead to a leak in that pipe. If such data is available, calculation of probability of risk of accident or an LOPC incident could be calculated.
Current Bayesian Belief models are based on expert opinion, and also provide fixed estimates of risks. If these models are connected to real data, estimates on these risks can be continuously re-evaluated, making risk management more proactive and predictive.
4.0 Insights Generated from Such Analysis
Risk management systems such as these can help HSE risk managers manage their risk portfolio, and control risks within a reasonable boundary.
4.1 It can help identify whether two indicators- logically related or not - are statistically correlated in operational areas. For e.g. In a particular process there might be very little positive correlation between preventive maintenance not done on time and corrective maintenance orders generated even though it is logically related. This can help managers to identify weak spots in the process.
4.2 It can help identify whether the effort put in managing a particular KPI is actually showing results. This can be achieved if a negative correlation is seen between a leading indicator which shows performance improvements and a lagging indicator like no. of injuries. E.g. If no. of injuries is falling with an increase in number of risk assessments then anegative correlation is seen. Ideal performance evaluation criteria would be to pursue a correlation closer to a score of -1
4.3 It can help identify whether there was unusual or extraordinary event within the business. Data will show disruptions in correlation, if there is a sudden increase or decrease -well beyond those routinely recorded- in the value of a given variable/indicator.
4.4 It can help identify accumulation of risk within a process in multiple areas, which can result in a larger catastrophic event. Measurement of cumulative value shows sudden or gradual deterioration of plant compliance to process, and gives sufficient lead time to management to act and defuse the situation.
4.5 It can provide internal or external benchmarks of safety performance to a given operation. Over a period of time, once sufficient data is gathered, the performance of a process in each area can be benchmarked with peers, and processes can be improved through internal exchange of best practices
5.0 Real-Life Use-cases for EHS Safety Monitoring
In many real life catastrophic incidents, a risk measurement system would be an ideal solution to the problem. In most incidents and accidents across process industries such as oil & gas and mining, a set of patterns are visible. The patterns are summarized here, but do not represent an exhaustive list.
Typical HAZOP/HAZID studies should capture these scenarios. So, any project that sets up leading variable risk studies can use such a repository to setup a leading risk performance system.
Conclusion
In our experimental setup, an analytical model was setup to create a series of leading indicator KPIs in Asset risk, Occupational Health and Safety, Competence-led risk, and an aggregate risk scenario model was created to show aggregation of risk within a process boundary. Using such a system, it is possible to manage operational risk of process industries like refining, oil extraction, and natural resource mining industries. Some of the use cases of risk management in process industries would be
Using the above approach enterprises can roll out an effective, future proof health and safety risk management system, and benefit from the savings in asset maintenance, workers compensation premiums reduction, better employee morale, and reduced losses due to work stoppages and productivity losses.
References
Raghuraman K. is a Senior Technology Consultant for Wipro in the area of Sustainability, Health & Safety with over 20 years of experience of developing technology and IT applications. For the last 2 years, he has worked in the area of Enterprise HSE Risk Management & Analytics, building risk data models, performance management, metrics, and dashboards for health & safety applications. Previously, since 2008, he has worked as Theme head, Green IT Product Management on setting up the Sustainability practice for Wipro Technologies covering global partnerships with various product vendors in the Sustainability applications space. Before 2008, he worked on roles ranging from delivery to technology solutions in telecom such as Hosted applications on Cloud model to telecom technology platforms.
Eshaan Thakur is a Business Analyst for Energy, Natural Resources and Utilities Business Unit HSSE Practice. Currently he works on data modeling and development of Key Performance Metrics, risk scoring techniques, statistical models for enhancing HSE risk visibility for enterprises. Previously he has industry experience of regulatory compliance management in small hydro power generation projects.
Eshaan holds a Masters Degree in Business Administration with specialization in Energy & Environment Management.